Anthropic published research on AI’s labor market impact. The chart is everywhere today. Here’s what it actually says — and what it doesn’t.
The chart
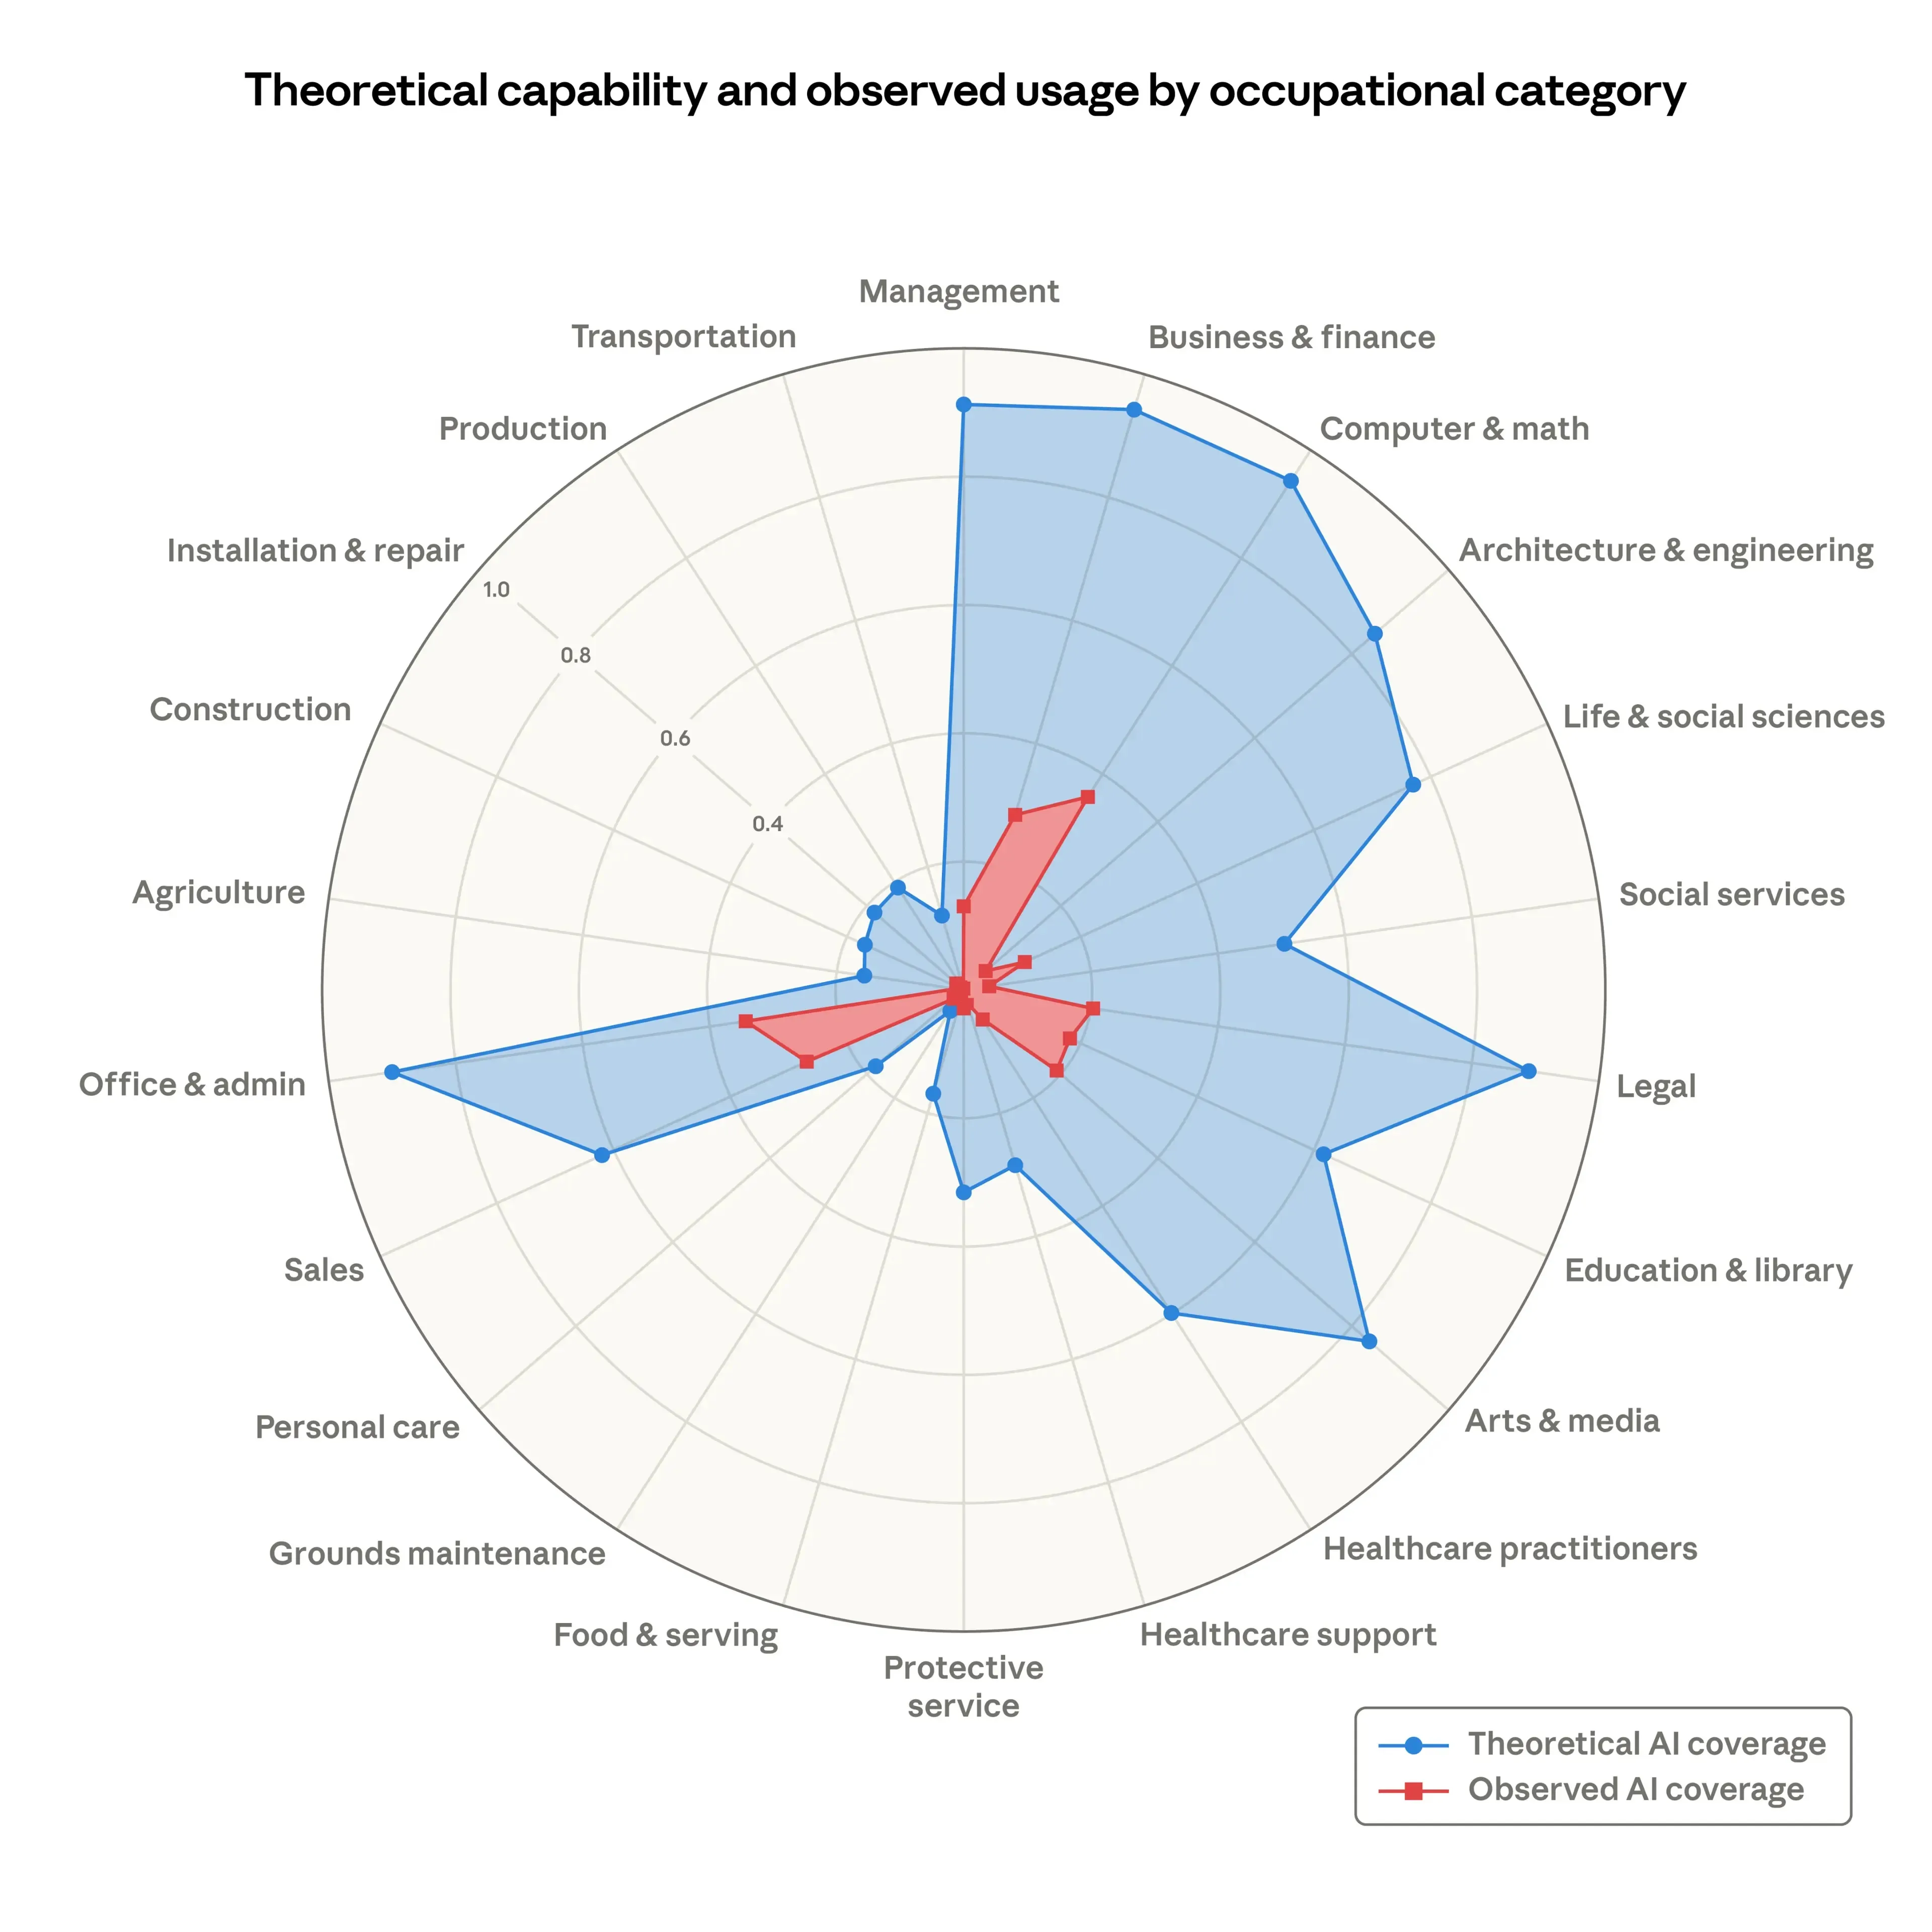
This is the chart everyone is sharing. Each axis represents an occupational category. The scale goes from 0 to 1 — that’s 0% to 100% of tasks in that occupation. The blue area shows what percentage of tasks could theoretically be sped up by AI. The red area shows how much people are actually using Claude for those tasks right now.
For Computer & Math roles, the blue reaches 0.94 — meaning 94% of tasks are theoretically coverable. The red sits at about 0.33 — meaning Claude is currently used for roughly 33% of those tasks.
The implication people are drawing: AI can already theoretically do 94% of Computer & Math tasks. It’s only a matter of time before it actually does.
But that’s not what the blue means. And almost nobody sharing this chart understands what it actually represents.
Where the data comes from
Both studies build on the same foundation: the O*NET database, maintained by the U.S. Department of Labor. It breaks down roughly 900 occupations into specific tasks. You can look up any occupation and see exactly what tasks define it — for example, Computer Programmers lists tasks like “Write computer programming code,” “Test software performance,” and “Modify software programs to improve performance.” Compare that to Electricians — “Work from ladders, scaffolds, or roofs to install, maintain, or repair electrical wiring” or “Fasten small metal or plastic boxes to walls to house electrical switches.”
These are the actual task descriptions that both studies scored. Go look at your own occupation — you might be surprised at how your job is defined.
What the blue actually is
From the Anthropic paper:
“Figure 2 shows observed exposure (in red) compared to β from Eloundou et al. (in blue).”
The blue comes from Eloundou et al. (2023), a study by OpenAI researchers. They defined exposure as:
“whether access to an LLM or LLM-powered system would reduce the time required for a human to perform a specific task by at least 50 percent.”
Can a human with LLM access do this task in half the time compared to without? If yes, the task counts as exposed.
From Eloundou et al., β scores tasks on a simple scale — 1 if a task can be doubled in speed by an LLM alone, 0.5 if it requires additional tools or software built on top of the LLM, and 0 otherwise.
Important detail: Anthropic collapsed the scoring. From their appendix, they set β:
“to 1 if β is above zero. This amounts to counting any tasks that are theoretically doable with an LLM or an LLM plus tools.”
So a task scored 0.5 — meaning it needs additional software that doesn’t exist yet — gets treated the same as a task scored 1 — meaning an LLM alone can do it. That inflates the blue area.
The occupation-level number is then a weighted average, weighted by how much time workers spend on each task. So when Computer & Math shows 0.94, it means tasks representing 94% of time spent in those roles were judged to be at least somewhat speedable — including tasks that would require tools that haven’t been built yet.
How was this scored? Not by actually testing tasks with an LLM. Human annotators and GPT-4 read O*NET task descriptions and made a judgment call. The LLM they were told to assume workers would have access to was from the GPT-3.5 family, with a 2,000-word input limit and no access to recent facts.
From the Eloundou rubric:
“Consider the most powerful OpenAI large language model… the context for the input can be captured in 2000 words.”
And from their methodology:
“at the time of labeling included models in the GPT-3.5 family but not in the GPT-4 family.”
The paper also acknowledges the limitations of this approach:
“A fundamental limitation of our approach lies in the subjectivity of the labeling.”
And:
The annotators “are not occupationally diverse, potentially leading to biased judgments regarding LLMs’ reliability and effectiveness in performing tasks within unfamiliar occupations.”
That’s the blue. Subjective human opinions from 2023 about whether GPT-3.5 could theoretically speed up tasks — with 0.5 scores lumped in with 1s — scored by people who may not fully understand the occupations they’re rating.
What the red actually is
The red area is Anthropic’s own contribution — measured from their 2025-2026 Claude usage data (Claude.ai conversations and API traffic). It tracks which of those theoretically exposed tasks people are actually using Claude for in professional settings.
From the paper:
“The red area, depicting LLM use from the Anthropic Economic Index, shows how people are using Claude in professional settings.”
Automated and API usage gets more weight than augmentative use. From the appendix:
“A task that sees only augmentative uses… would have αt equal to 0.5. A task with only automative uses would have αt = 1.”
So the red isn’t just “people are using Claude for this” — it’s weighted toward automated, production-level usage rather than someone asking Claude a question at their desk.
What Anthropic’s data actually found
Their paper opens with:
“finding limited evidence that AI has affected employment to date.”
On unemployment:
“the unemployment rate of the more exposed group has increased slightly but the effect is indistinguishable from zero.”
They tested this at every threshold — from the median to the 95th percentile of exposure. From the appendix:
“in all cases, the impact is flat or negative.”
They cross-checked with Department of Labor unemployment insurance data. Same result:
“The pooled estimate in the post-ChatGPT period is 0.1 percentage point and insignificant, echoing the main results.”
The only signal: a 14% drop in the hiring rate for workers aged 22-25 into exposed occupations. Their own description:
“just barely statistically significant” with “several alternative interpretations” — including that “the young workers who are not hired may be remaining at their existing jobs, taking different jobs, or returning to school.”
The track record of predictions like these
The paper’s own introduction is honest about this:
“a prominent attempt to measure job offshorability identified roughly a quarter of US jobs as vulnerable, but a decade on, most of those jobs maintained healthy employment growth.”
They also note:
“studies on the employment effects of industrial robots reach opposing conclusions, and the scale of job losses attributed to the China trade shock continues to be debated.”
What this actually is
The paper is careful. It’s a measurement framework, not a displacement prediction. It explicitly states the framework:
“is most useful when the effects are ambiguous.”
The methodology is transparent. The findings are honestly reported. The paper is genuinely interesting and worth reading in full.
The narrative being built around it is a different story entirely.
It’s also worth reading this as what it is: a company measuring the impact of its own product, using its own usage data, published on its own website. A company that sells AI tools publishing data about how much of the economy its product could theoretically cover is not neutral research — regardless of how careful the methodology is.
Read the paper, not the chart.
Sources:
- Massenkoff & McCrory (2026), “Labor market impacts of AI: A new measure and early evidence”
- Eloundou, Manning, Mishkin & Rock (2023), “GPTs are GPTs: An Early Look at the Labor Market Impact Potential of Large Language Models”
- O*NET OnLine — U.S. Department of Labor occupational database